Making Open-Data Useful

Lessons from Diagram Chasing

Vivek Matthew
Aman Bhargava

If you can’t see the projector, slides are at
https://aman.bh/to/indiafoss

Who we are

Vivek

  • Government website hoarder

  • Occasional open data publisher

  • Fan of maps (including OpenStreetMap)

Aman

  • Designer, programmer

  • Maps, data journalism, public technology enthusiast

  • Has too many ideas

Some work from the past year

BLR Water Log

Drainage patterns in Bangalore as a convenient map, with historical context.

Who is My Neta?

Easy and intuitive explorer for browsing affidavits and parliamentary activity of elected MPs.

Votes in a Name

Building on the previous project, we analyzed election candidate names to find out “namesakes” which could have potentially flipped the election.

How do you find more namesakes like S Veeramani and S .V Ramani?

This is what 0.0001% of the National Time Use Survey looks like for the average user

Is this open data actually accessible?

Usually the answer is somewhat.

  • Account required on MoSPI portal
  • Data split across multiple files
  • Coded values need separate lookup tables
  • Cryptic column headers
  • Documentation buried in PDFs
  • Requires programming skills to explore

Open data that’s technically available but practically inaccessible to most people who could benefit from it.

India Time Use Explorer

We cleaned up the dataset and made it so that you can answer any query without code.

Run complex aggregations and SQL queries all in-browser in a GUI.

Who spends more time cleaning up after meals?

We aim to create things with data that aren’t the same old dashboards or dry summaries

It’s never been easier to spin up a dashboard for your open-data with a few prompts.

It’s also never been easier for your audience to ignore yet another dashboard.

How can you make your open-data more inviting and accessible? We’ve got some thoughts

Let us show you CBFC Watch.

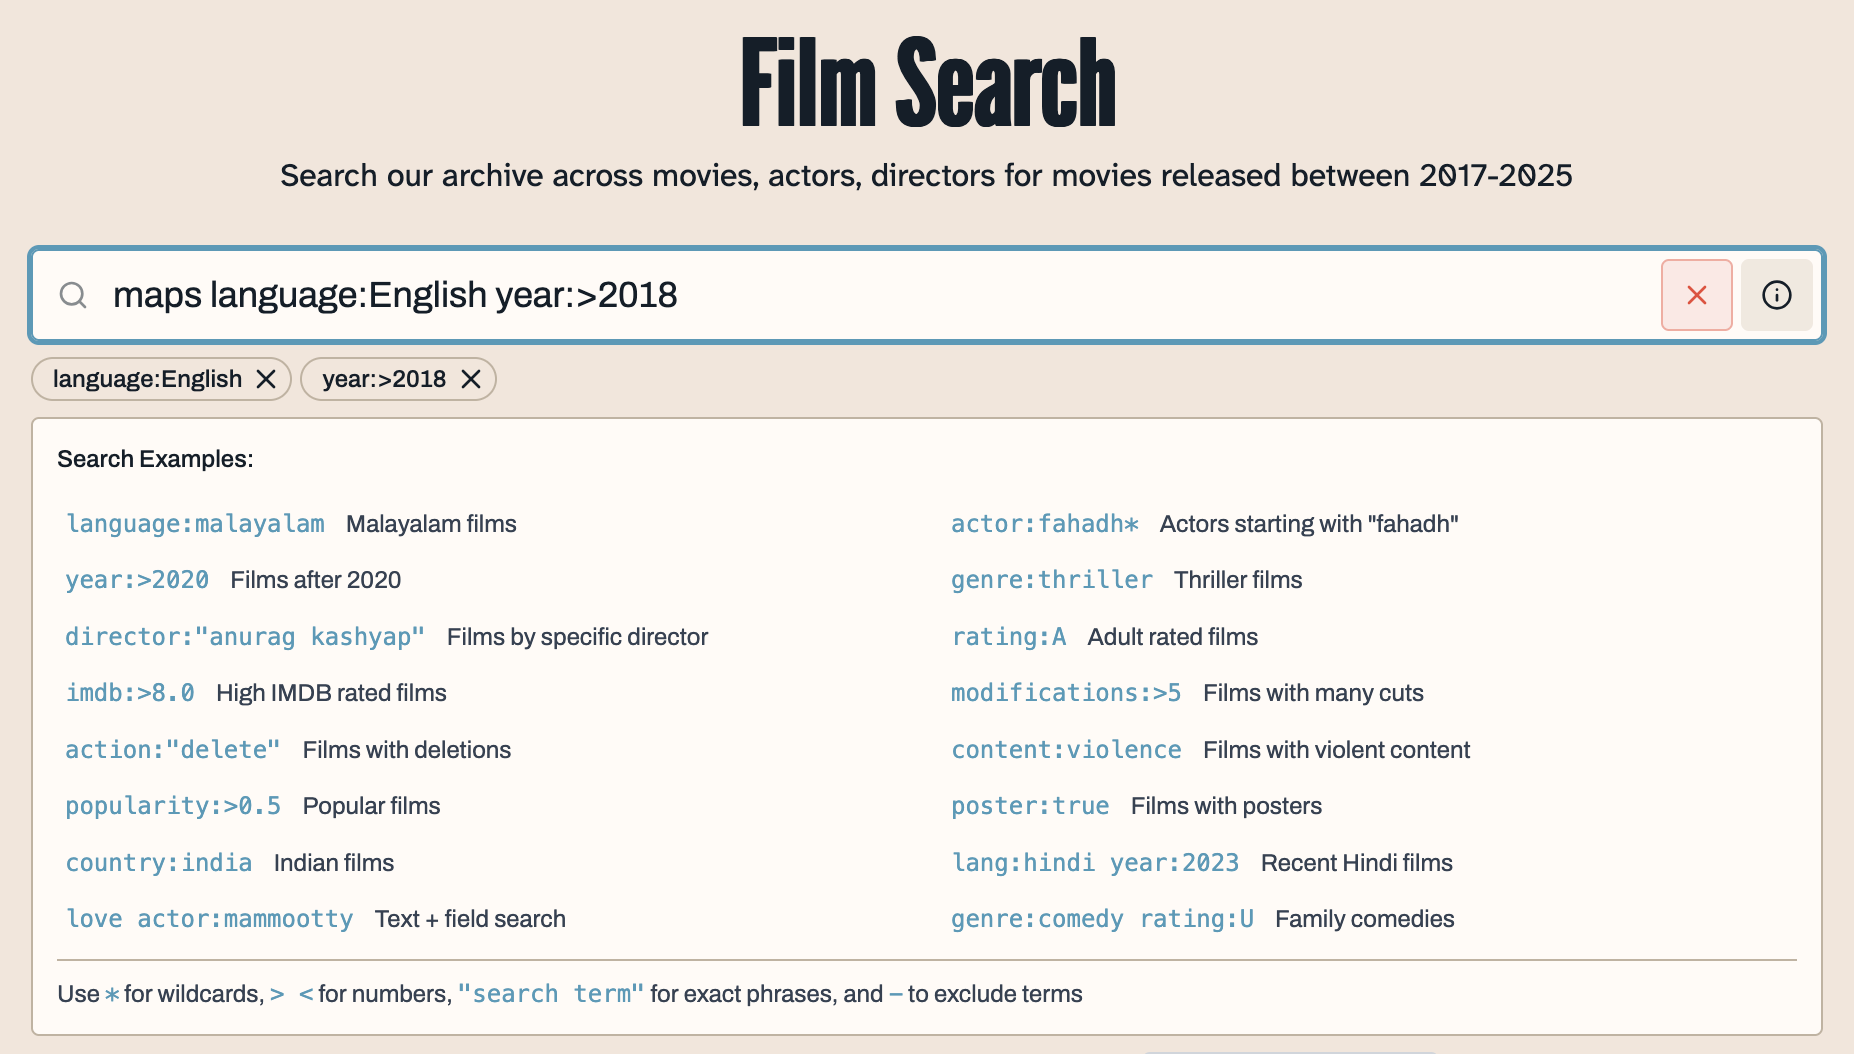
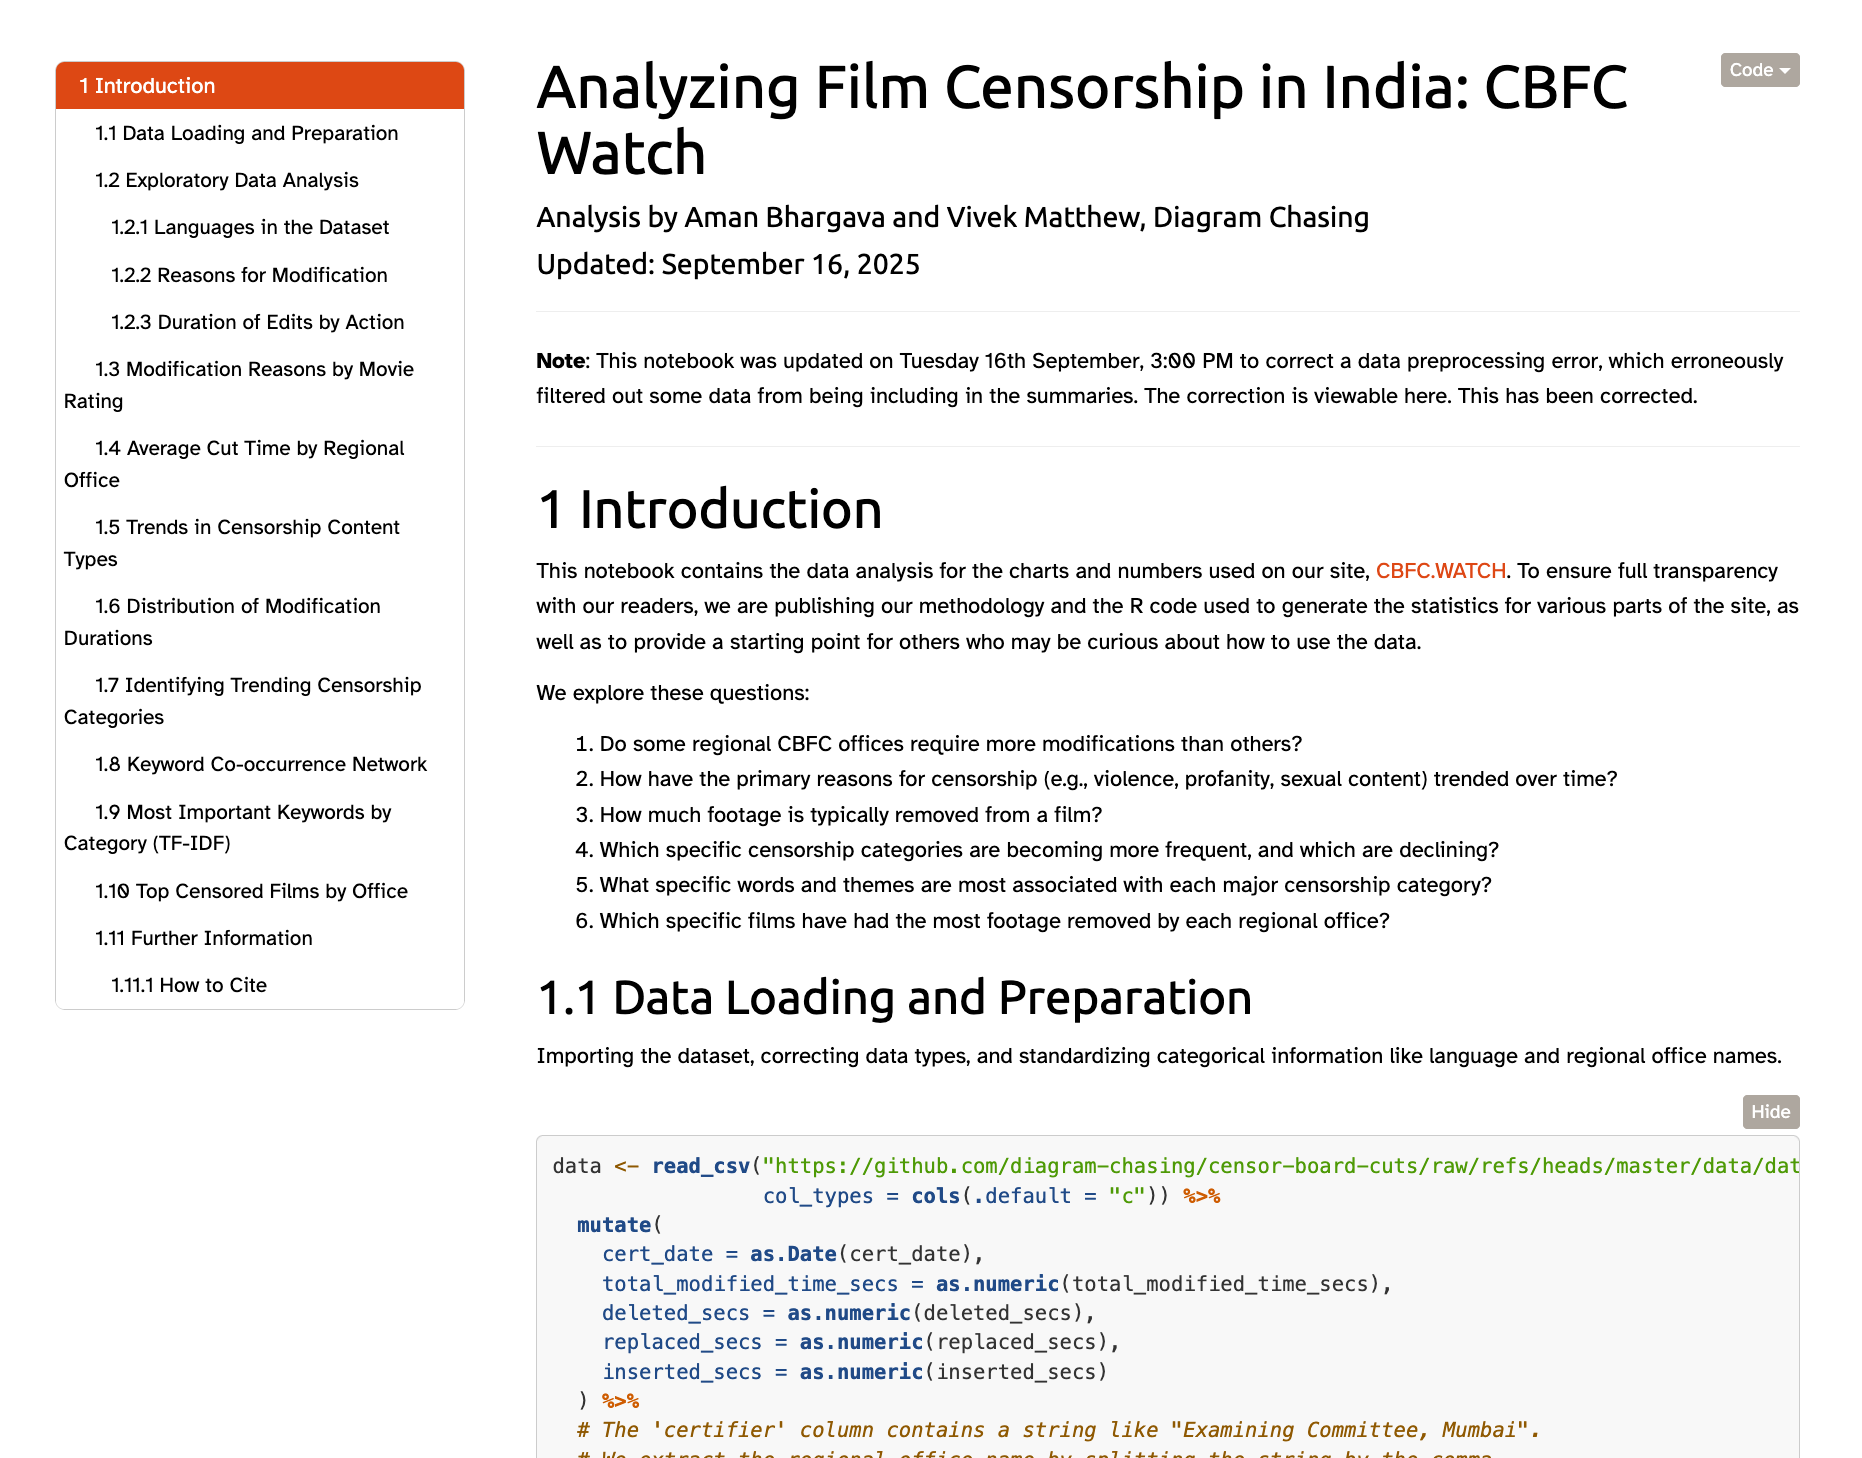
For the first time, search through thousands of censorship records

Browse cross-referenced keywords

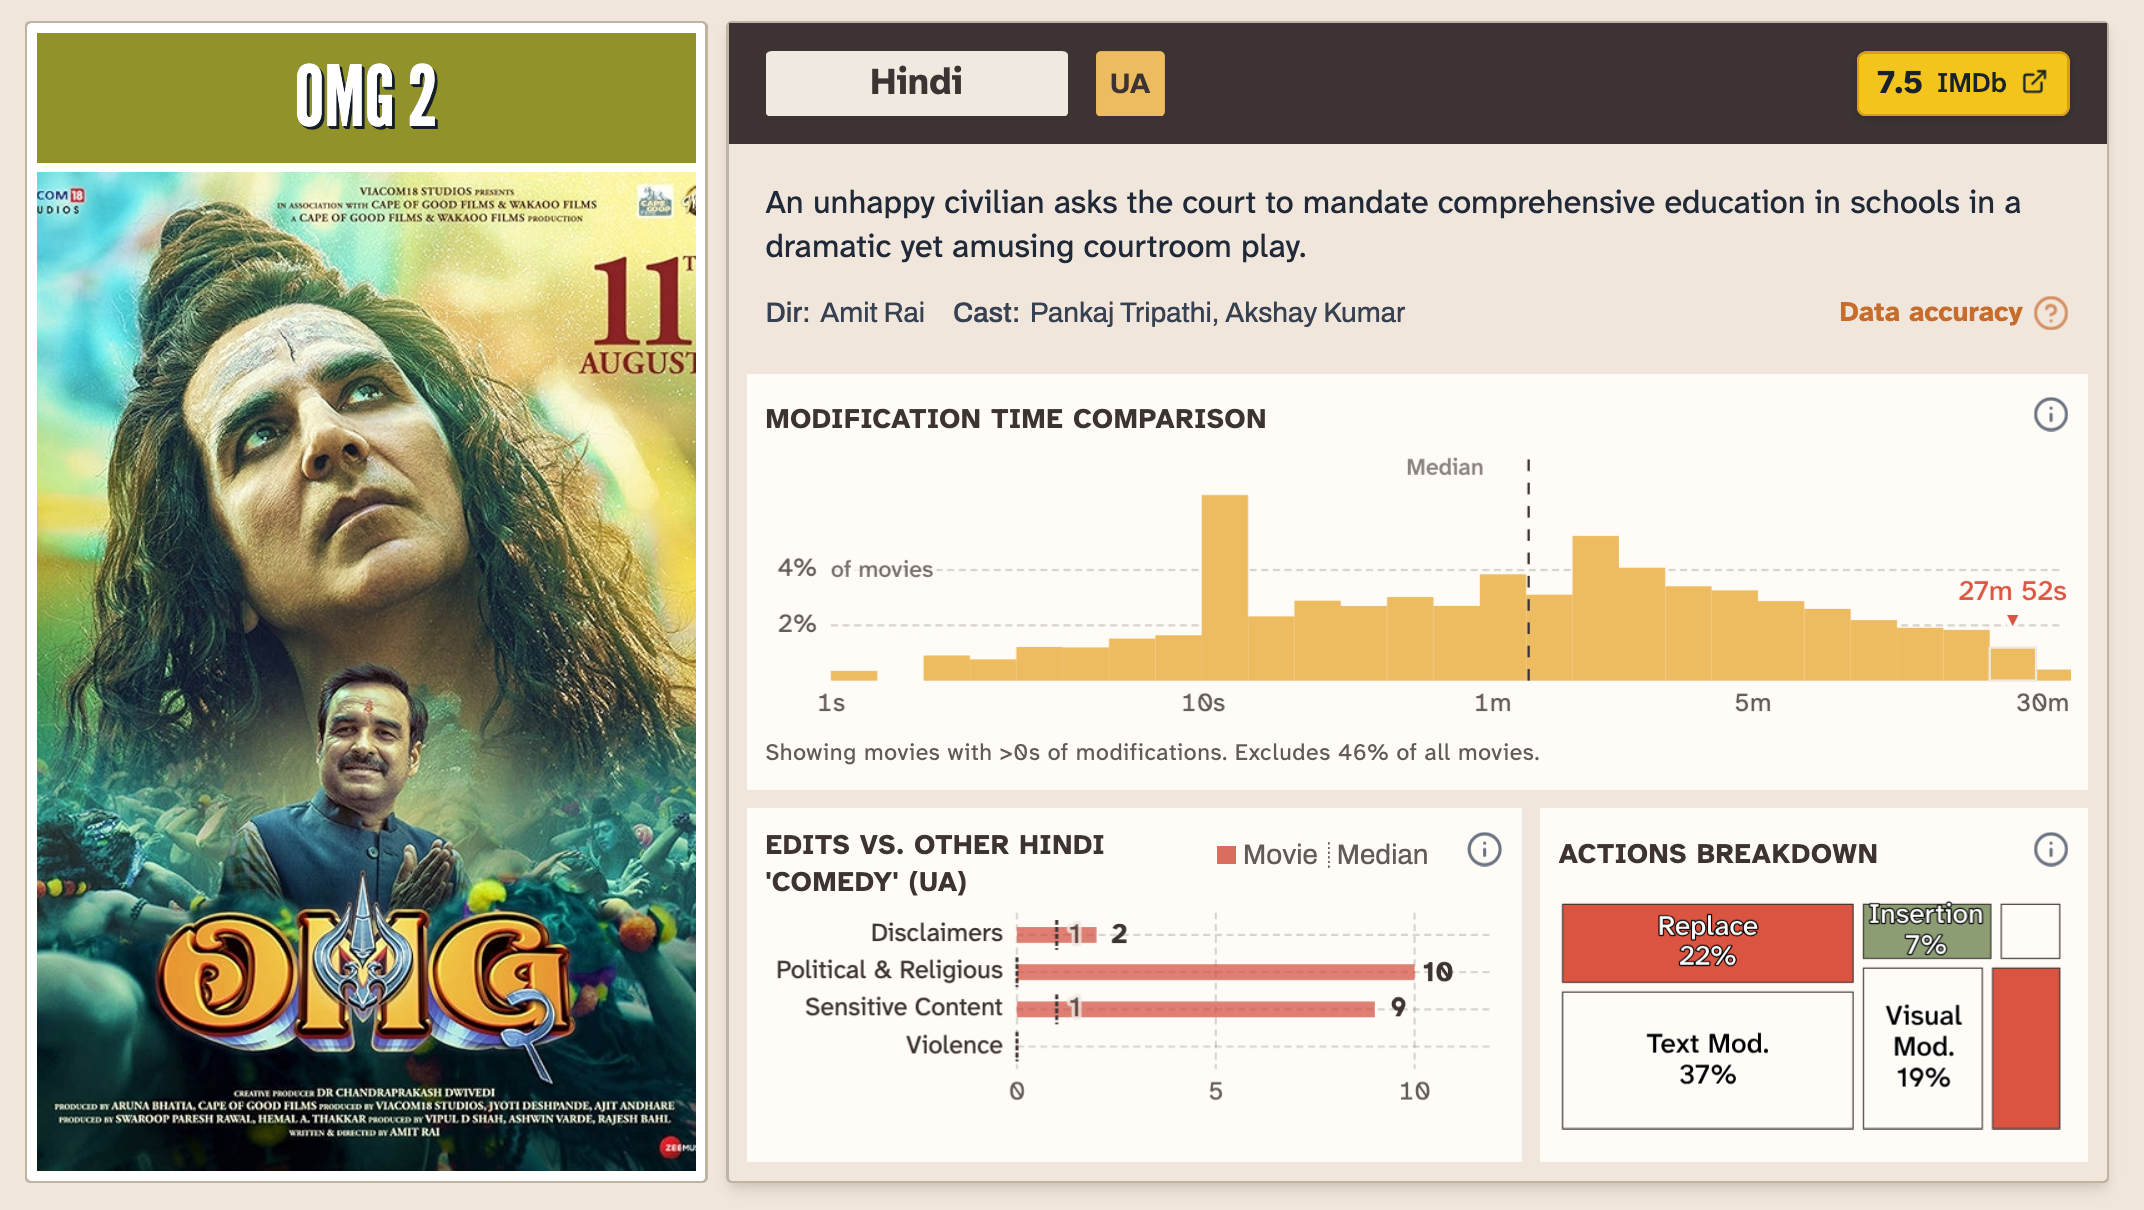
Each film leads you to others like it, creating links between 18,000 movies based on censorship

Understand a film in context

Normally the only way to find a certificate for a movie is to go around searching for something like this in a theatre

On opening the URL, the certificate is displayed with the list of cuts made to the film.

This also gives us our most prized possession.

A URL!

https://www.ecinepramaan.gov.in/cbfc/?a=Certificate_Detail&i=100090292400000155

And what is better, a URL with numbers that look like they could make sense.

Decoding the URL Parameter

Breaking down the numbers

100090292400000155

100090292400000001

100090292300000001

100080202300000001

What could these numbers mean?

Breaking down the numbers

100090292400000155

100090292400000001

100090292300000001

100080202300000001

Appears everywhere, probably a prefix

  • 1000

Breaking down the numbers

100090292400000155

100090292400000001

100090292300000001

100080202300000001

These set of digits appear in pairs, we’ll figure these out later

  • 90 appears in most examples
  • 80 in some examples. Maybeeee a code?

Breaking down the numbers

100090292400000155

100090292400000001

100090292300000001

100080202300000001

Clear year pattern:

  • 2924 → 2024
  • 2923 → 2023
  • 2023 → 2023

Breaking down the numbers

100090292400000155

100090292400000001

100090292300000001

100080202300000001

The final digits represent the sequential certificate number for that office and period.

Try it out

Now we could guess more i values, and we kept changing them in the URL. Sometimes you get a 404, but other times something loads!

How do you get it out of the page?

The Network Tab is your friend!

If a website is loading data in your browser, you can probably scrape it.

Use the Network Tab to see what is being loaded in the browser

HAR Files

HAR is a convenient format to record the API calls for a page

  • Developer Tools → Network Tab
  • Load the target page containing data of interest
  • Save all as HAR

The HAR file contains all HTTP requests made when the page loaded, including any headers, session IDs, cookies; whatever the site needs to fetch data.

For us, it looked something like this:

{
  "startedDateTime": "2025-09-18T11:53:45.757+05:30",
  "request": {
    "method": "POST",
    "url": "https://www.ecinepramaan.gov.in/cbfc/...",
    "headers": [...],
    "postData": {...}
  },
  "response": {
    "status": 200,
    "headers": [...],
    "content": {...}
  }
}

LLMs in scraping and cleaning

There are many ways to go from a HAR file to a functional scraper

One quick way is to feed it to an LLM and prompt it to write a scraper

Works surprisingly well most of the time!

Soon enough, we had a functional scraper

Always save the original HTML files in case the government pulls the rug

Making it human readable

  • Build a parser to read HTML files
  • Extract only the relevant content
  • Export everything to CSV format

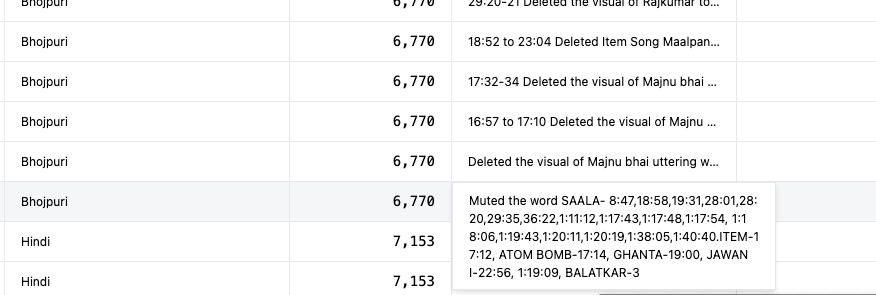
This data was still unusable because the information that users cared about was hidden in piles of text and timestamps with no context.

Also, modifications alone weren’t enough.

  • Who made the movie?
  • Who acted in the movie?
  • Which studio?
  • When did it release?
  • How can I analyze trends, if any?

Attempt #1:

Manual Classification

FYI: We don’t use LLMs for analysis

If we want to answer questions that interest others, it should come from our own interests and curiosity. If we don’t care, why would you?.

But then why use it here?

If you were going to manually categorize them anyway, it is a subjective decision that can be passed on to an LLM.

Attempt #2:

Large Language Models

Detailed prompts + Edge case examples = Text categorization that also cleans up messy content for better readability.

## Classification Schema
**action_types**: deletion, insertion, replacement...
**content_types**: violence, profanity, political...
**media_elements**: music, visual_scene, text_dialogue...
{
  "cleaned_description": "string",
  "reference": "string" or null,
  "action": "string",
  "content_types": ["string"],
  "media_element": "string"
}
Input: "Muted the word FUCK at 01:12:29"
Output: {
  "reference": "fuck",
  "action": "audio_modification",
  "content_types": ["profanity"]
}

Costs are neglible for the value

Results:

  • 100K descriptions processed
  • ₹1,500 total cost
  • ₹0.015 cost per description

Now we have analyzable metadata!

Before:

01:32:59:00 Replaced the whole V.O. stanza about caste system of Manu Maharaj. Aabadi hain Aabad .Aur unka jivan sarthak hoga To Aabadi hain Aabad nahiazhadi ki

After:

Clean Description: Replaced a voice-over passage discussing the caste system.

Categories: - REPLACEMENT - TEXT DIALOGUE - IDENTITY REFERENCE

Topic: CASTE

Now what?

80% of the people will not go through this CSV.

For us, exposing people to what we found exciting is important.

Otherwise, this dataset is futile.

  • How do we communicate this excitement?

  • Can we think from the user’s point of view? What can be a hook for them?

Most likely, they would want to

Find movies of their interest

Search random keywords

Share with others

Browse and roam through this dataset

Typesense, a powerful self-hosted FOSS alternative to Algolia.

Since we needed almost every field of the metadata to be searchable, we needed to come up with a solution to minimize the UI surface.

This is bad

Extra time spent perfecting search.

Let users make queries like they would in Google, we’ll do the complex operations.

Typesense doesn’t come with this, so we built a parser ourselves.

function parseQuery(input) {
  // Find field:value patterns with quotes, wildcards, operators
  const fieldPattern = /(\w+):(.*?)/g;

  const fieldQueries = [];
  let textQuery = input;

  while ((match = fieldPattern.exec(input)) !== null) {
    const [fullMatch, field, value] = match;

    let operator = '=';
    let processedValue = value;

    if (value.startsWith('"')) {
      processedValue = value.slice(1, -1);        // exact match
    } else if (value.endsWith('*')) {
      operator = 'CONTAINS';                      // wildcard search
      processedValue = value.slice(0, -1);
    } else if (value.match(/^[><=]+/)) {
      operator = value.match(/^([><=]+)/)[1];     // comparison
      processedValue = parseFloat(value.replace(/^[><=]+/, ''));
    }

    fieldQueries.push({ field, operator, value: processedValue });
    textQuery = textQuery.replace(fullMatch, '').trim();
  }

  return { textQuery, fieldQueries };
}

Do to others as you would have them do to you

The platform is ALWAYS just one view of the dataset.

Most dashboards, including government ones, pretend to be the final answer. LOOK NO BEYOND ME!

Instead,

Think about the various kinds of users your data might attract, can you make their lives easier?

Show them one way to slice the data. Get them thinking of more!

We extensively document all data releases because we want users to use this data.

No guesswork.

Detailed notebooks! Ready-to-go

Documentation promotes use

Documentation promotes use

Documentation promotes use

Design, UX are not just visual but systemic choices.

As engineers and programmers, we sometimes don’t want to spend time adding “glitter”.

  • “I don’t know how to design”
  • “There are more important things to do”
  • “It works, that’s enough”
  • “Users can figure it out”

But good design, in all its forms, becomes evident when you’re an end-user yourself.

Survey of India creates the official government maps

They make the process of accessing them very inviting.

OpenStreetMaps in comparison…

How many BYD Cars were registered in Bengaluru in 2025?

MoRTH releases vehicle registration statistics

https://vahan.parivahan.gov.in/vahan4dashboard/

Multi-step process to access data

  • Designed for use in a specific way
  • No/minimal documentation for the data
  • Data quality issues

How could this be better?

https://india-vehicle-stats.pages.dev/KA/ALL/2025?name=BYD+INDIA+PRIVATE+LIMITED

Design for lowest friction. For you and others.

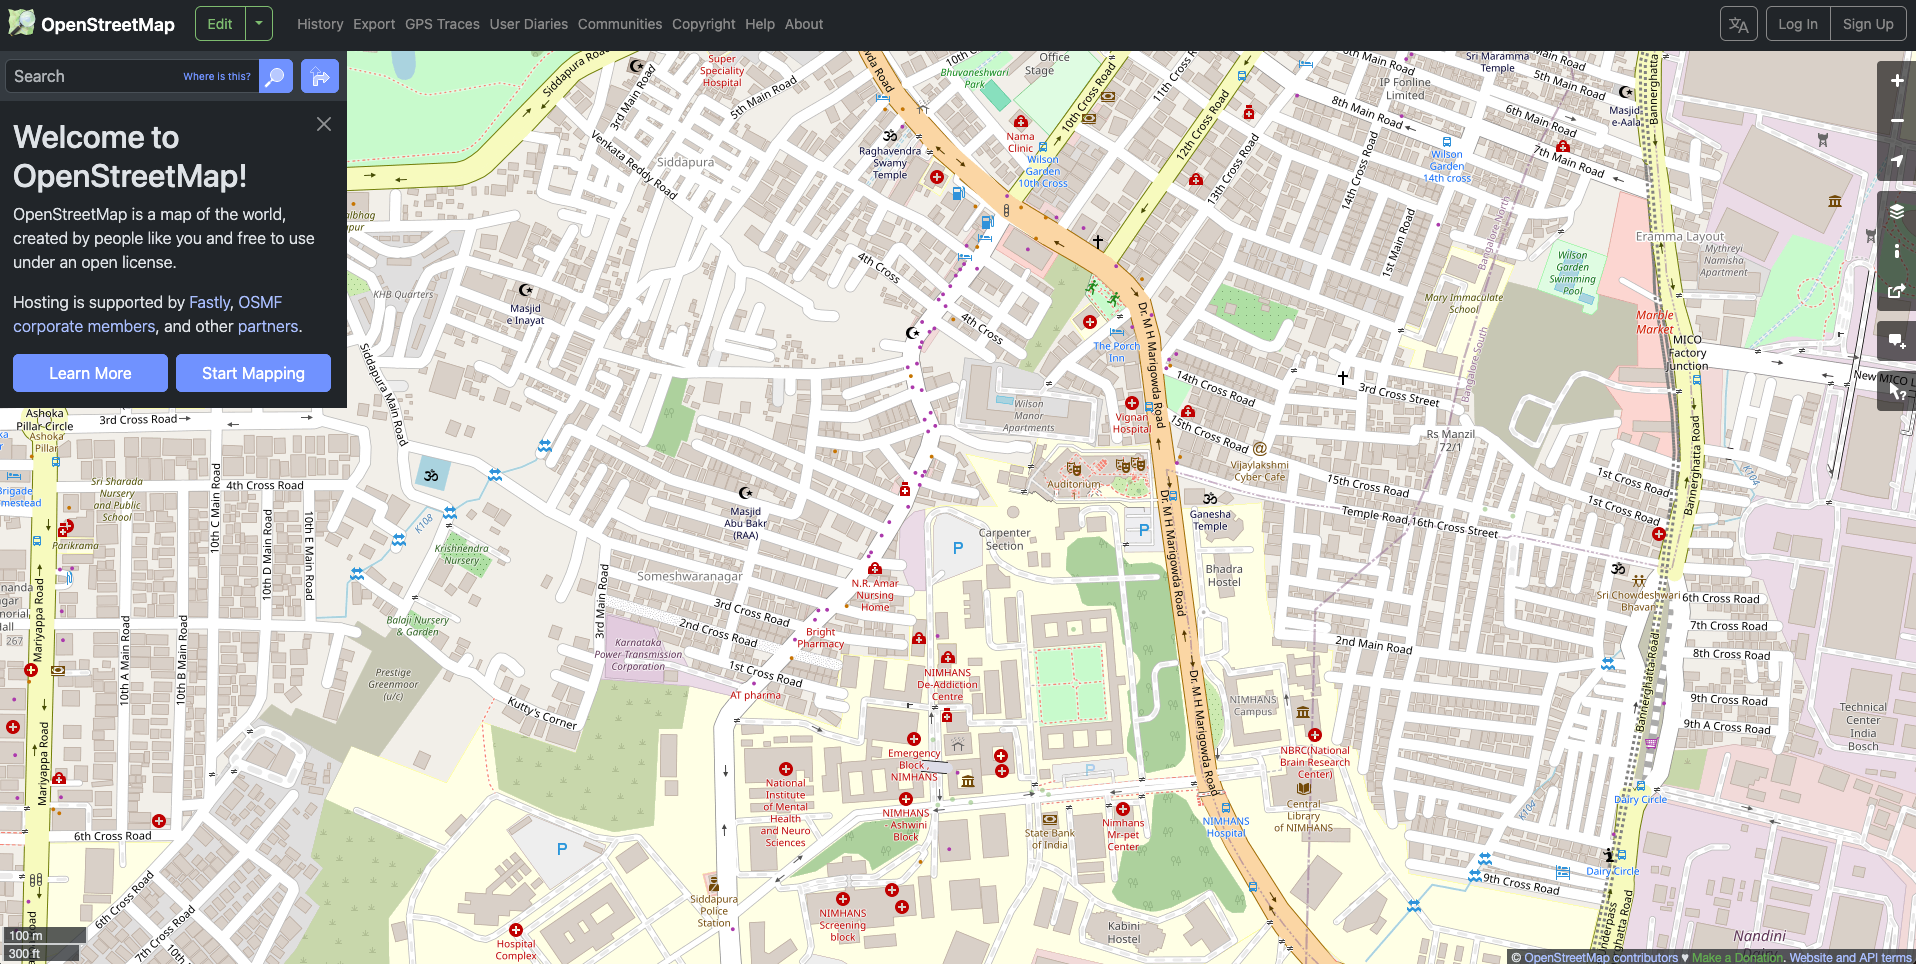
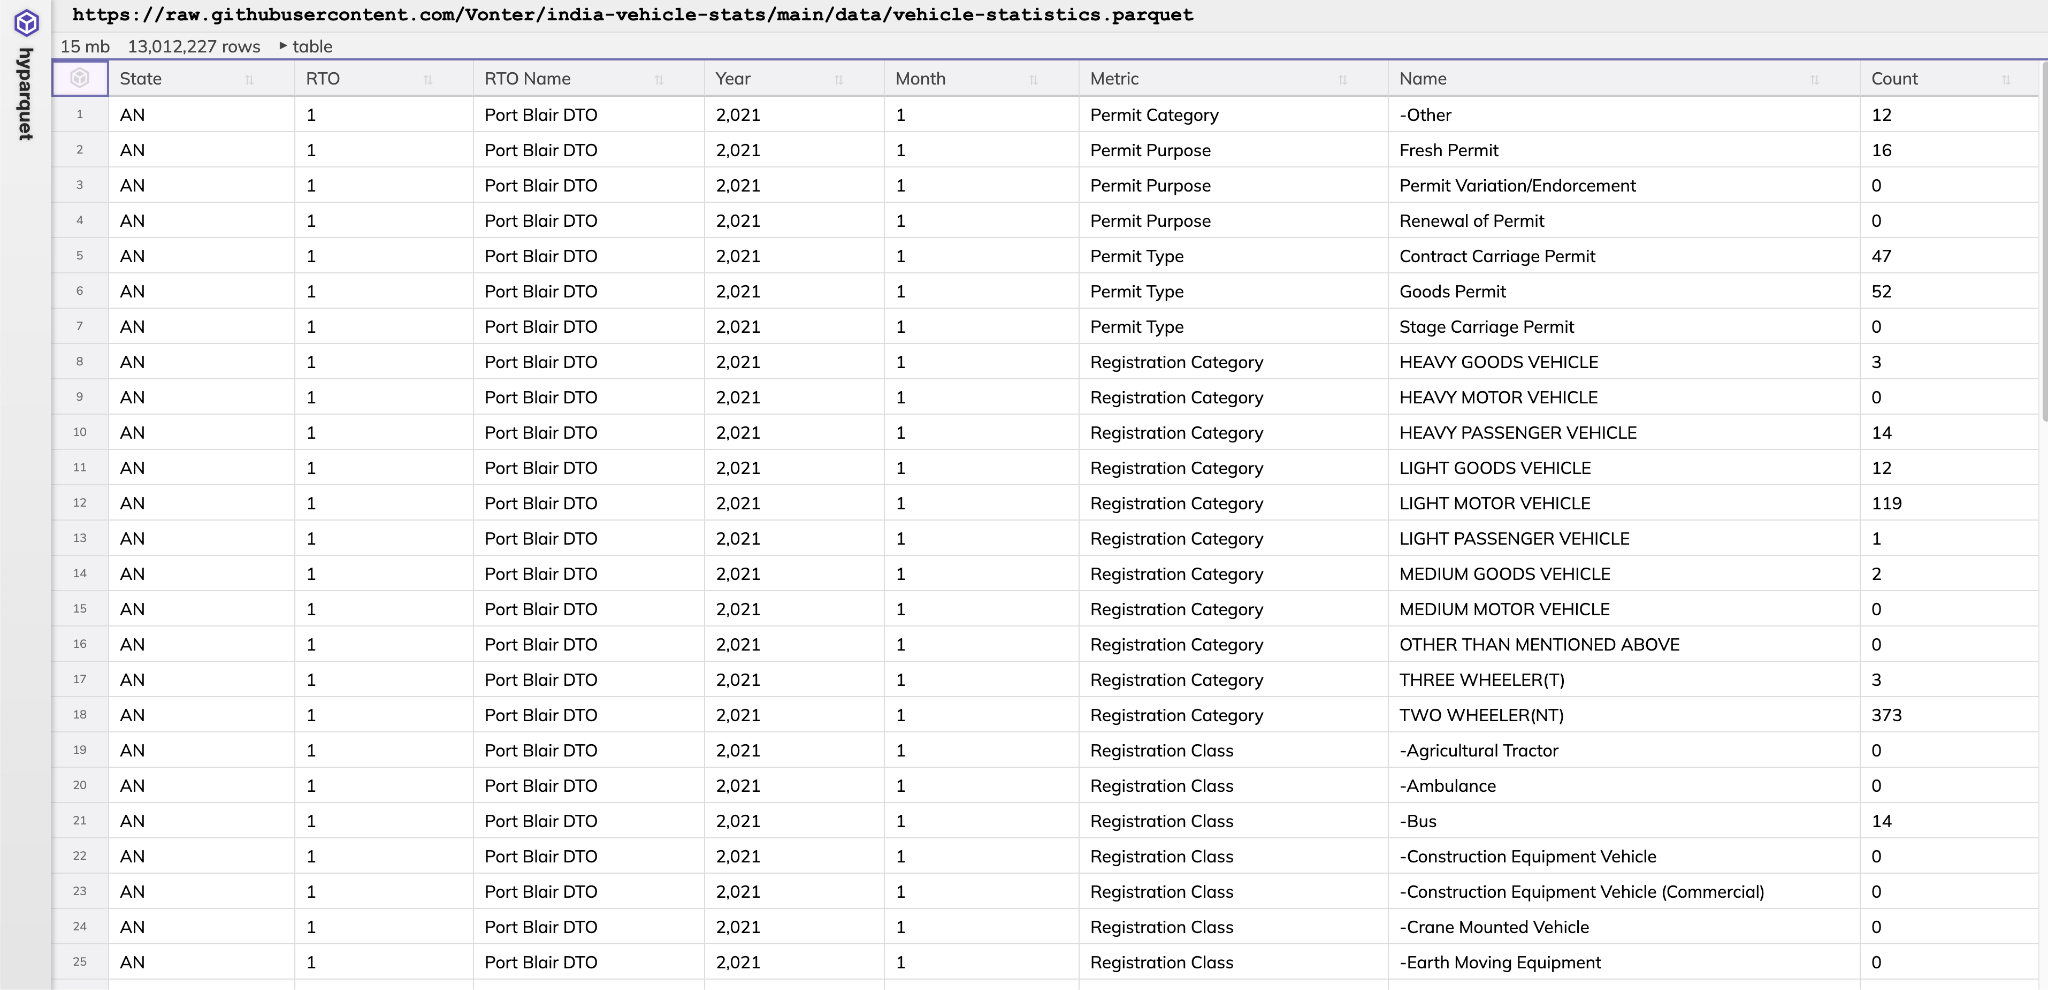
Meet people where they are: in the browser!

FlatGithub, HyParquet let people see the data without downloading.

Everything can be static

Static sites and web-apps mean you get to move on with your life.

  • No servers to maintain or debug
  • No recurring hosting costs
  • Deploy once, works forever
  • Scales automatically

Examples: Sveltekit for apps• PMTiles + Maplibre for maps • DuckDB-WASM for data queries • Observable Plot for charts • Pyodide/R-WASM for data analysis and notebooks

Start with the user intent, not the data structure

  • Construct and design around what people want to know
  • Where possible, create multiple entry points for different user types

This includes everything from just creating a set of CSVs to explorers.

  • Documentation, datasets and notebooks for researchers and technical folks
  • Thoughtful user-interface for anyone else

Make data discoverable and linkable

Especially when designing applications and dashboards:

  • Every piece of data should have a permanent URL
  • Enable deep linking to specific queries, filters, and results

Design for sharing.

If users can’t link to it, they can’t discuss it

Documentation as a first-class feature

Documentation is what saves your data from being ignored.

Write data dictionaries, document sample analysis, create basic charts, explain edge-cases and limitations upfront.

Invite people in.

Three Scripts Workflow

Fetch Script

Extract data from web APIs and endpoints

Tools: Network tab, HAR files

Parse Script

Clean and structure the raw data

Tools: BeautifulSoup, regex

Aggregate Script

Join, analyze, and prepare final datasets

Tools: Pandas, DuckDB

Combining datasets creates better value

Individual datasets have limited utility and good context comes from joining multiple sources.

  • ADR (Election Affidavits)
  • PRS (Parliamentary Activity)
  • MPLADS (Developmental Spending)

It might not even be a “dataset”

Beauty and craft matter more than you think

Aesthetic quality signals care, invite exploration and sharing.

Good design makes your work memorable in a sea of utilitarian dashboards.

Treat reproducibility as essential

  • Open source all code and methodology
  • Document data pipeline decisions
  • Enable others to verify and extend your work

For us, this will be fully achieved when we are able to create educational resources around the project in addition to the output.

Thanks for listening!

diagramchasing.fun